Hard water isn't evenly distributed across Australia. The concentration of minerals in your tap water depends on where the supply comes from and how the local water network is managed. As a result, hardness can shift dramatically between cities, towns and even suburbs.
Some Australian cities have naturally softer water, while others have supplies with a higher mineral content. Even in the same metropolitan area, different suburbs can have different hardness readings.
Across this guide, we’ll compare hardness results across Australia’s capital cities, identify where harder water tends to be more common and explain how to find the figures for your own water supply.
Is water in Australia hard or soft?
Australia has both hard and soft water supplies. There’s no single hardness level that applies across the whole country because the mineral content varies with geology, groundwater and the sources used by each utility.
The Australian Drinking Water Guidelines (ADWG) use total hardness, measured as milligrams per litre of calcium carbonate (mg/L CaCO₃) to assess the potential for scale formation. Their guidance defines water below 60 mg/L as soft, while readings between 60 and 200 mg/L are considered good quality for domestic use. Above 200 mg/L, the likelihood of limescale increases.
It’s important to remember the 200 mg/L figure is an aesthetic guideline meant to minimise scale in your hot water system. It's not a health-based limit or a point where the water becomes unsafe to drink.
The difference between Australian water supplies is massive. Some cities have average readings below 60 mg/L, while some regional towns record levels above 500 mg/L. Looking at hardness by location will give you a much clearer picture than looking at a state average.

Water hardness across Australia's major cities
Water hardness data isn’t always reported in the same way. Some utilities publish an average across a network; some provide results for individual zones, reservoirs or sampling sites. The figures below reflect the latest relevant published information available for each city, but they shouldn’t be treated as exact like-for-like rankings.
Perth
Perth has some of the widest variations in hardness among Australia’s city networks. The Water Corporation’s 2024-25 water quality report records average hardness readings ranging from 48 mg/L at Hills Direct to 228 mg/L at Two Rocks.
Other localities fall in between this range. Armadale/Kelmscott recorded an average of 75 mg/L, Greenmount at 95 mg/L and Neerabup at 190 mg/L. Two Rocks was the only reported Perth locality in the table with an average above the 200 mg/L guideline.
This reflects the size and complexity of Perth’s Integrated Water Supply Scheme. The network uses a combination of groundwater, surface water, desalinated seawater and groundwater replenishment, with different zones getting different mixes.
Adelaide
Adelaide’s metropolitan water supply tends to have a higher mineral content than softer supplies in cities like Melbourne and Sydney. According to SA Water’s 2024-25 annual water report, hardness results taken from treatment plants range from 101 mg/L in the Happy Valley zone to 136 mg/L at Hope Valley.
Other plant readings fall within this range. Anstey Hill recorded an average of 132 mg/L, Little Para 131 mg/L and Barossa 114 mg/L. The five metropolitan treatment plants reveal a relatively narrow spread in average source water hardness across the city.
Adelaide’s drinking water comes from a combination of the River Murray, reservoirs in the Mount Lofty Ranges, groundwater and desalinated seawater. SA Water manages these sources through its metropolitan supply network, treating water before it reaches homes and businesses.
Brisbane
Brisbane’s water hardness varies slightly between sampling locations, though recent results sit comfortably below the ADWG’s 200 mg/L aesthetic threshold. Seqwater publishes the results for individual sampling locations, including Camerons Hill, Aspley Reservoir and Wellers Hill.
Seqwater’s September 2026 monitoring recorded an average hardness of 129 mg/L at Camerons Hill near Mount Crosby, with results of 120 mg/L at both the Aspley and Wellers Hill Reservoirs. These are individual site results, not a single average for Brisbane. The number of samples also varied between locations.
The three monitoring locations recorded similar average hardness levels, suggesting a fairly consistent mineral content across these parts of the South East Queensland supply network.
Melbourne
Melbourne has some of the softest metropolitan water in Australia. Melbourne Water’s water quality analysis, last updated in October 2024, recorded hardness readings between 9 and 38 mg/L across six major storage reservoirs after primary treatment.
The Upper Yarra storage recorded the lowest range, at 9 to 14 mg/L, while Tarago recorded the highest, at 27 to 38 mg/L. All six reservoir results were below the 60 mg/L threshold used to define soft water.
These figures demonstrate how naturally low the mineral content can be across Melbourne’s major water sources. There’s still differences between reservoirs, though, and the results represent treated water at storage locations as opposed to a direct measurement at a household tap.
Sydney
Sydney Water reports an average hardness level of approximately 57 mg/L for the Greater Sydney area. This places the supply just below the 60 mg/L threshold used to classify soft water.
While this provides Sydney with a relatively low concentration of minerals compared to many other regional Australia supplies, the average doesn't necessarily represent every property in the metropolitan area. Water chemistry can change between supplies, so a specific reading is ideal if you’re investigating the conditions at home.
Sydney's water supply comes from a network of dams, rivers and desalination, with water treated and distributed across the Greater Sydney region. The overall average offers a useful snapshot of the city's water, although the mineral content can vary between different areas.
Canberra
Canberra’s water supply is classified as soft, with Icon Water reporting an average hardness level of approximately 43 mg/L as calcium carbonate for its customers, putting it below the 60 mg/L threshold.
The figure comes from Icon Water’s 2021-22 data, making it older than the results available for several other capital cities. It's still a useful indication of Canberra’s relatively low mineral content.
Canberra’s drinking water is sourced primarily from three catchments: the Cotter, Googong and Murrumbidgee. Water is treated at local facilities before entering the distribution network, with Icon Water monitoring quality throughout the supply system.
Darwin
Darwin has relatively soft drinking water, with Power and Water’s 2024 Annual Drinking Water Quality Report recording an average hardness of 35 mg/L. This places the city’s supply below the soft water threshold.
This is considerably lower than the hardness levels found in some inland Northern Territory communities, where groundwater supplies can contain higher concentrations of naturally occurring minerals.
Darwin relies heavily on surface water from Darwin River Dam, supplemented by groundwater from local bores. This gives the city a different water supply profile from inland communities that depend more on groundwater.
Hobart
Hobart has very soft drinking water, with TasWater’s monitoring data recording a hardness range from 17 mg/L up to 46 mg/L across the Greater Hobart region.
This variation sees the softest levels at around 17 mg/L in Kingborough, moving up to roughly 24 mg/L in central Hobart and Sandy Bay, 30 mg/L in Glenorchy, and reaching a maximum of 46 mg/L in Clarence on the Eastern Shore.
Greater Hobart relies on surface water catchments, including the Derwent River via the Bryn Estyn treatment plant, Lake Fenton and Mount Wellington offtakes. This gives the city supply a lower mineral profile that prevents severe scale buildup in appliances.
Where is hard water most common in regional Australia?
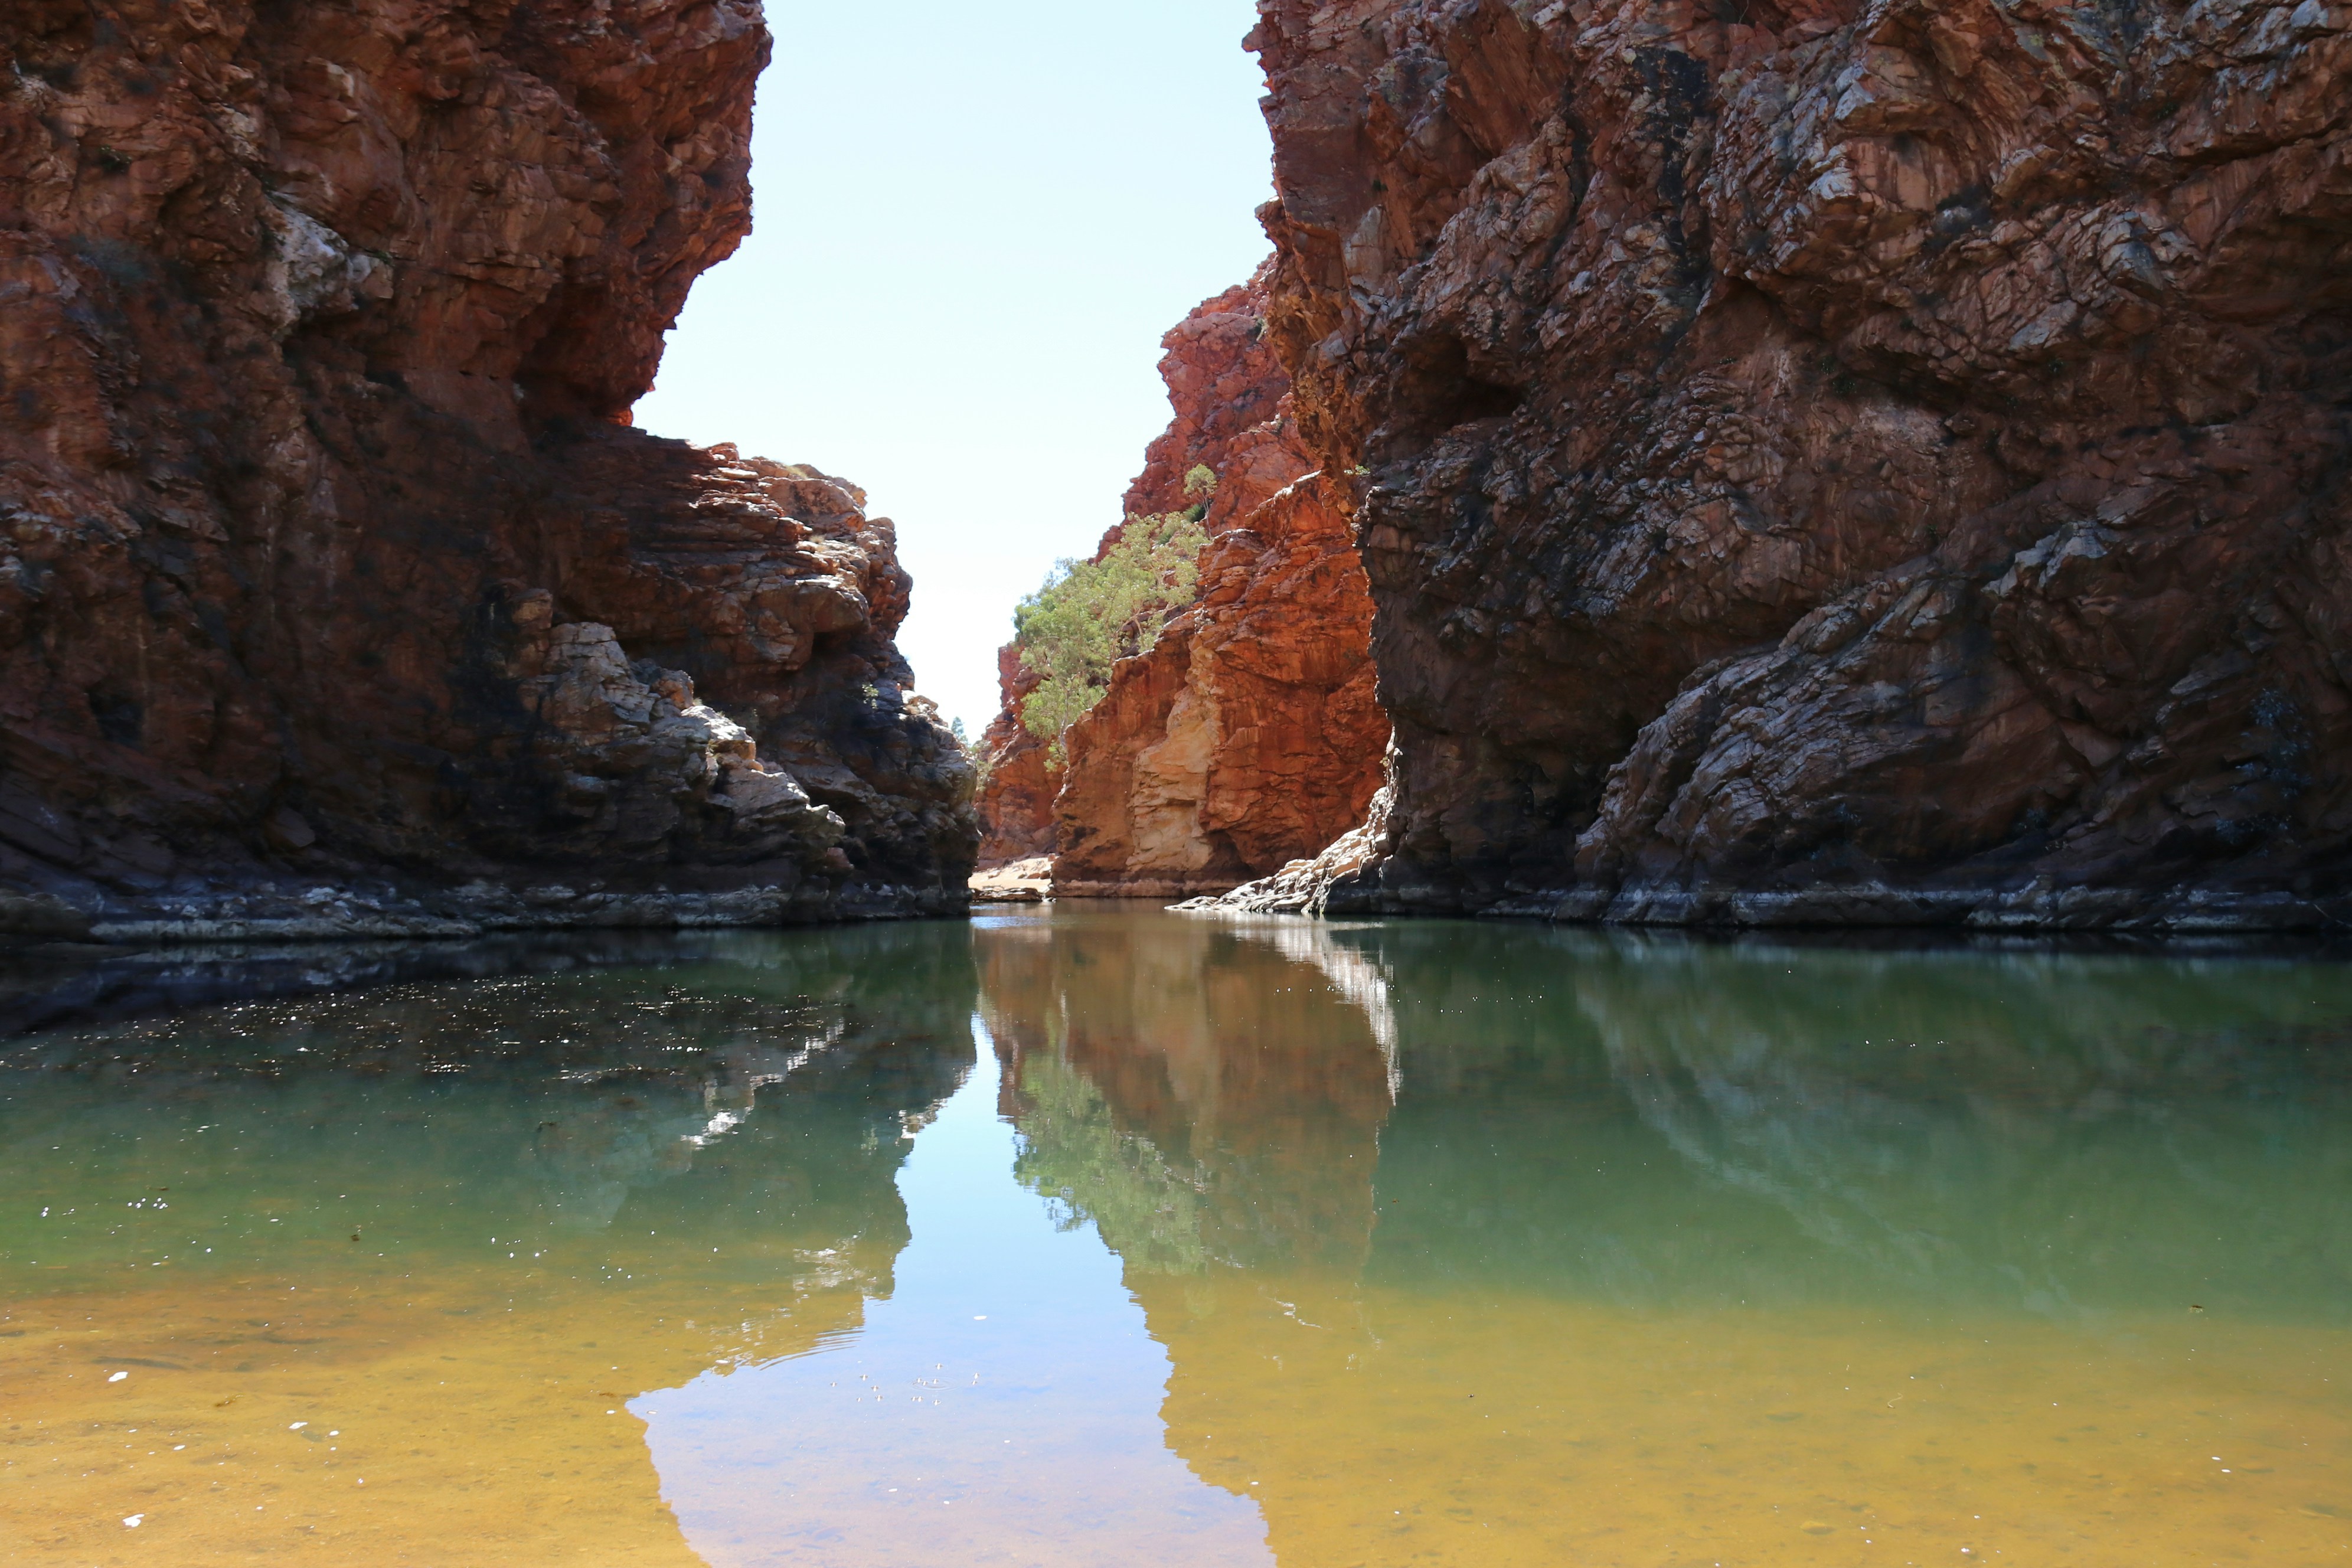
Some of Australia’s highest water hardness readings are recorded outside the major metropolitan areas. Regional towns that rely on groundwater can receive supplies with considerably higher calcium and magnesium levels than those recorded in many capital cities.
The underlying geology is an important influence, but groundwater doesn’t automatically mean hard water. The composition of an aquifer, the depth of the bore and any treatment applied to the supply all affect the final result.
Groundwater supplies and inland towns
Groundwater is more likely to have elevated hardness when it moves through mineral-bearing soil and rock, dissolving calcium and magnesium along the way. In areas where groundwater is the main drinking water source, this can result in higher hardness levels than those found in surface water supplies.
The Northern Territory provides some of Australia’s clearest examples. Power and Water’s reporting recorded a hardness of 240 mg/L in Alice Springs, 340 mg/L in Mataranka, 420 mg/L in Kings Canyon and 570 mg/L in Daly Waters.
The report highlights groundwater reliance as a major reason for the higher readings across parts of the Katherine and Southern regions. It also shows that hardness can differ substantially between nearby regional supply areas.
These results contrast with Darwin’s much lower average of 35 mg/L. They demonstrate why regional water quality needs to be considered at the town level instead of making assumptions based on the state.
Limestone regions and naturally mineral-rich water
Limestone geology can contribute to higher water hardness because calcium carbonate dissolves as groundwater moves through the rock. The amount of calcium and magnesium that enters the water depends on the local geology and the conditions within the aquifer.
Mount Gambier provides an example of this. The Blue Lake/Warwar, which supplies the city, receives groundwater that seeps into the volcanic crater through the region’s porous limestone. The surrounding Limestone Coast also holds extensive groundwater systems that support local water supplies.
The presence of limestone doesn’t automatically indicate that a town has hard water. Groundwater chemistry varies between aquifers, and treatment can alter the characteristics of the water before it reaches households.
SA Water’s information on South Australian groundwater sources and the South Australian Government’s Limestone Coast Regional Plan provide further background on the region’s aquifers.
Private bore water and rural properties
Households using private bore water can experience different hardness levels from nearby properties connected to a town water network. Each bore draws from a specific groundwater source, and the mineral content depends on the surrounding geology, aquifer conditions and extraction depth.
Two properties in the same rural district might have different calcium and magnesium levels. A nearby town’s water quality report won’t necessarily reflect the supply coming from a private bore on a single property.
If your home relies on bore water, a laboratory test is the most reliable way to establish its hardness. It’s also important to test for other relevant chemical and microbiological traits, especially where bore water is used for drinking, bathing or cooking.
The WA Department of Health recommends testing private drinking water supplies through a property accredited laboratory. Its bore water guidance explains what to test for and why groundwater quality should be checked before using it in the home.
Why water hardness can differ between suburbs and neighbouring towns
A city’s water supply is rarely drawn from one source and distributed unchanged across an entire network. Utilities manage connected reservoirs, treatment plants, bores and pipelines to meet demand and maintain water quality. This means the source(s) supplying a certain suburb can influence the measured hardness.

Local water sources and supply networks
Groundwater and surface water can contain different concentrations of calcium and magnesium. Water drawn from an aquifer may have spent a long time in contact with mineral-bearing rock, while water sourced from a reservoir is shaped by the geology of its catchment.
Utilities can also use desalinated water or water from multiple reservoirs and groundwater sources. Each source has its own mineral profile, and the resulting supply reflects the water entering the treatment and distribution network.
Perth is a prime example of a metropolitan system that uses multiple source types. The Integrated Water Supply Scheme combines groundwater, surface water, desalinated seawater and groundwater replenishment. The distribution of these sources across the network helps to explain the inconsistent readings across the metropolitan area.
The Water Corporation explains how these sources contribute to Perth’s water supply. Similar differences can occur in other cities where supply networks draw from multiple reservoirs or systems.
Seasonal changes and blended water supplies
The water entering a supply network can change throughout the year as utilities manage dam storage, rainfall, groundwater availability and customer demand. When the mix of sources changes, the mineral composition of the delivered water may also change.
For example, Perth’s water supply now relies on a combination of sources that can be stored and distributed as demand changes. Melbourne Water also notes the characteristics of its water can vary throughout the year depending on which reservoir supplies a particular area.
These operational changes don’t mean that every home will experience a noticeable change in hardness each season. However, they’re a reason why singular test results might not represent the water supplied across an entire year.
When checking local water quality, look for the testing period and whether the reported result is a single sample, monthly average or a longer-term figure, which will help put any variation into context.
Why city-wide averages don't tell the whole story
A city-wide average combines water hardness readings from multiple locations across a supply network. While this provides a useful synopsis of water quality, it can disguise differences between individual supply areas. Two homes in the same city might get different water with different mineral concentrations, depending on where their supply comes from.
The way results are collected matters, too. For example, Seqwater’s monitoring recorded an average hardness of 129 mg/L at Camerons Hill, compared with 120 mg/L at both the Aspley and Wellers Hill reservoirs. However, the number of samples differed between these locations, meaning the averages were based on different amounts of data.
It’s also important to check where a measurement was taken. Some water authorities report results from treatment plant inlets, while others publish measurements from reservoirs, distribution zones or customer supply areas. These represent different stages in the supply network, so the results won’t necessarily be directly comparable.
For an accurate understanding of your home’s water hardness, look for results from the smallest relevant supply area published by your water utility. If those figures aren’t available, testing water directly at your property can be a more comprehensive option.
How to find the water hardness in your area
The most reliable starting point is your local water utility. Most Australian providers publish drinking water quality information through annual reports, suburb-based search tools or monthly sampling results.
Look for a result labelled hardness, total hardness or total hardness as calcium carbonate. If you can’t find a figure for your suburb, your utility might be able to identify the right supply zone or explain where its results are published.
Where to find your water utility's hardness results
Water providers use different reporting systems, so the process depends on where you live. These official resources cover the major metropolitan networks:
Perth and regional WA: Water Corporation's drinking water quality reports include annual data tables organised by locality and region.
Adelaide and regional SA: SA Water's drinking water profile lets you search by suburb or postcode and view results from the previous 12 months.
Brisbane and South East Queensland: Seqwater's sampling site reports provide water quality results for individual locations.
Melbourne: Melbourne Water's water quality testing results show typical readings across major storage reservoirs.
Sydney: Sydney Water's "What's in your water" tool provides information about water chemistry in your area.
Canberra: Icon Water's water quality information explains the hardness of its supply and relevant appliance settings.
Darwin and regional NT: Power and Water's drinking water quality reports include results for individual urban centres.
Hobart and Tasmania: TasWater's monthly water quality portal lets you search by suburb or supply system.
These resources are great for comparing water quality across Australia, but make sure you choose the report for the right location. A state-wide or regional result might cover several networks with different mineral profiles.
How to read local water hardness figures
Water hardness is typically recorded in milligrams per litre (mg/L) of calcium carbonate equivalent. This represents the combined contribution of calcium and magnesium ions, rather than the concentration of either on its own.
Since reports list calcium and magnesium separately instead of presenting a total hardness figure. In that case, check whether the utility also publishes a calculated hardness value, as the individual readings can’t be directly compared with a total hardness figure without conversion.
It’s also important not to confuse hardness with total dissolved solids (TDS). TDS measures the overall concentration of dissolved substances in water, while hardness specifically relates to the minerals that contribute to limescale. A higher TDS doesn’t automatically mean a higher hardness level.
For a consistent comparison, look for total hardness reported in mg/L as CaCO₃ and use the same measurement when comparing different locations.
What to check when comparing water quality data
Before using a figure to assess your household’s supply, check a few details in the report:
Reporting period: Confirm whether the result covers a month, a year or an older testing period.
Sampling period: Check whether the sample comes from a reservoir, treatment plant, distribution network or customer supply point.
Reported value: Identify whether the figure is a minimum, maximum, average or range. These describe different things and can’t be compared as if interchangeable.
Supply area: Confirm that the result applies to your suburb or water network. Council boundaries and postcodes don’t always match up to water supply zones.
Measurement: Make sure you’re comparing total hardness in mg/L as calcium carbonate, rather than calcium alone or TDS.
These details help separate a general indication of local water quality from a measurement that’s actually relevant to your property.
What Australia's water hardness means for homeowners
Hardness data helps to explain why different households in Australia can have different experiences with their water. A property supplied by naturally soft sources will have a different profile from one connected to a groundwater supply with concentrated calcium and magnesium levels.
Understanding your household's local water supply
Start with the water quality information published for your suburb or supply zone. This gives you an indication of the mineral content entering the local network and helps establish whether your household receives soft water or a supply with higher hardness.
For properties using private bores, rainwater or additional on-site water storage, utility figures may not reflect the water reaching your taps. A sample taken from the property’s supply is more appropriate in these circumstances.
It’s also worth considering what you want to address. Hardness is one aspect of Australian water quality, and a higher mineral reading doesn’t mean all the other aspects of your water need treatment.
When to investigate water treatment options
A whole home filtration system might be worth considering when measured hardness, recurring scale deposits or household water requirements indicate that mineral reduction would be beneficial.
The type of treatment matters. Standard activated carbon filtration can reduce substances like chlorine, but it doesn’t remove dissolved calcium and magnesium. Addressing hardness requires a process specifically designed to reduce those minerals, such as an ion-exchange water softener.
That’s why your system should be chosen according to the incoming water to your property and the issues you want to address. Hardness is a different issue from filtering sediment or reducing chlorine, and there’s no one filtration stage that can do all three.